Results & Outputs
Contents
Results & Outputs#
Once processing has completed the following files are created in the locally mounted volume; boresight calibration data are only ever stored locally regardless of the location of the input files.
Filename |
Description |
|---|---|
|
Configuration file which describes the inputs to the calibration process |
|
Log file produced during the calibration process |
|
Status file produced during the calibration process |
|
A CSV file containing boreight offest angles |
|
The will be four images demonstrating the tie points identifed in each pair of flight lines, matching Flight A with B and Flight B with A. More info about Tie Point images is below |
|
A box plots showing the |
Results file#
The content of this file will look like this sample:
pitch,roll,heading,generated_date,config_file
0.1457217756013034,0.12201583709934247,-5.774666731660165,2023-10-31 08:20:11,
This file will be available to select on the Processing Control Panel in the Boresight correction drop down list.
Tie Point images#
The series of four jpeg files demonstrate where there are common points in flights A and B in each flight line pair when the tie points are set to automatic. Common points are joined with a coloured line and should be vertical in every case.
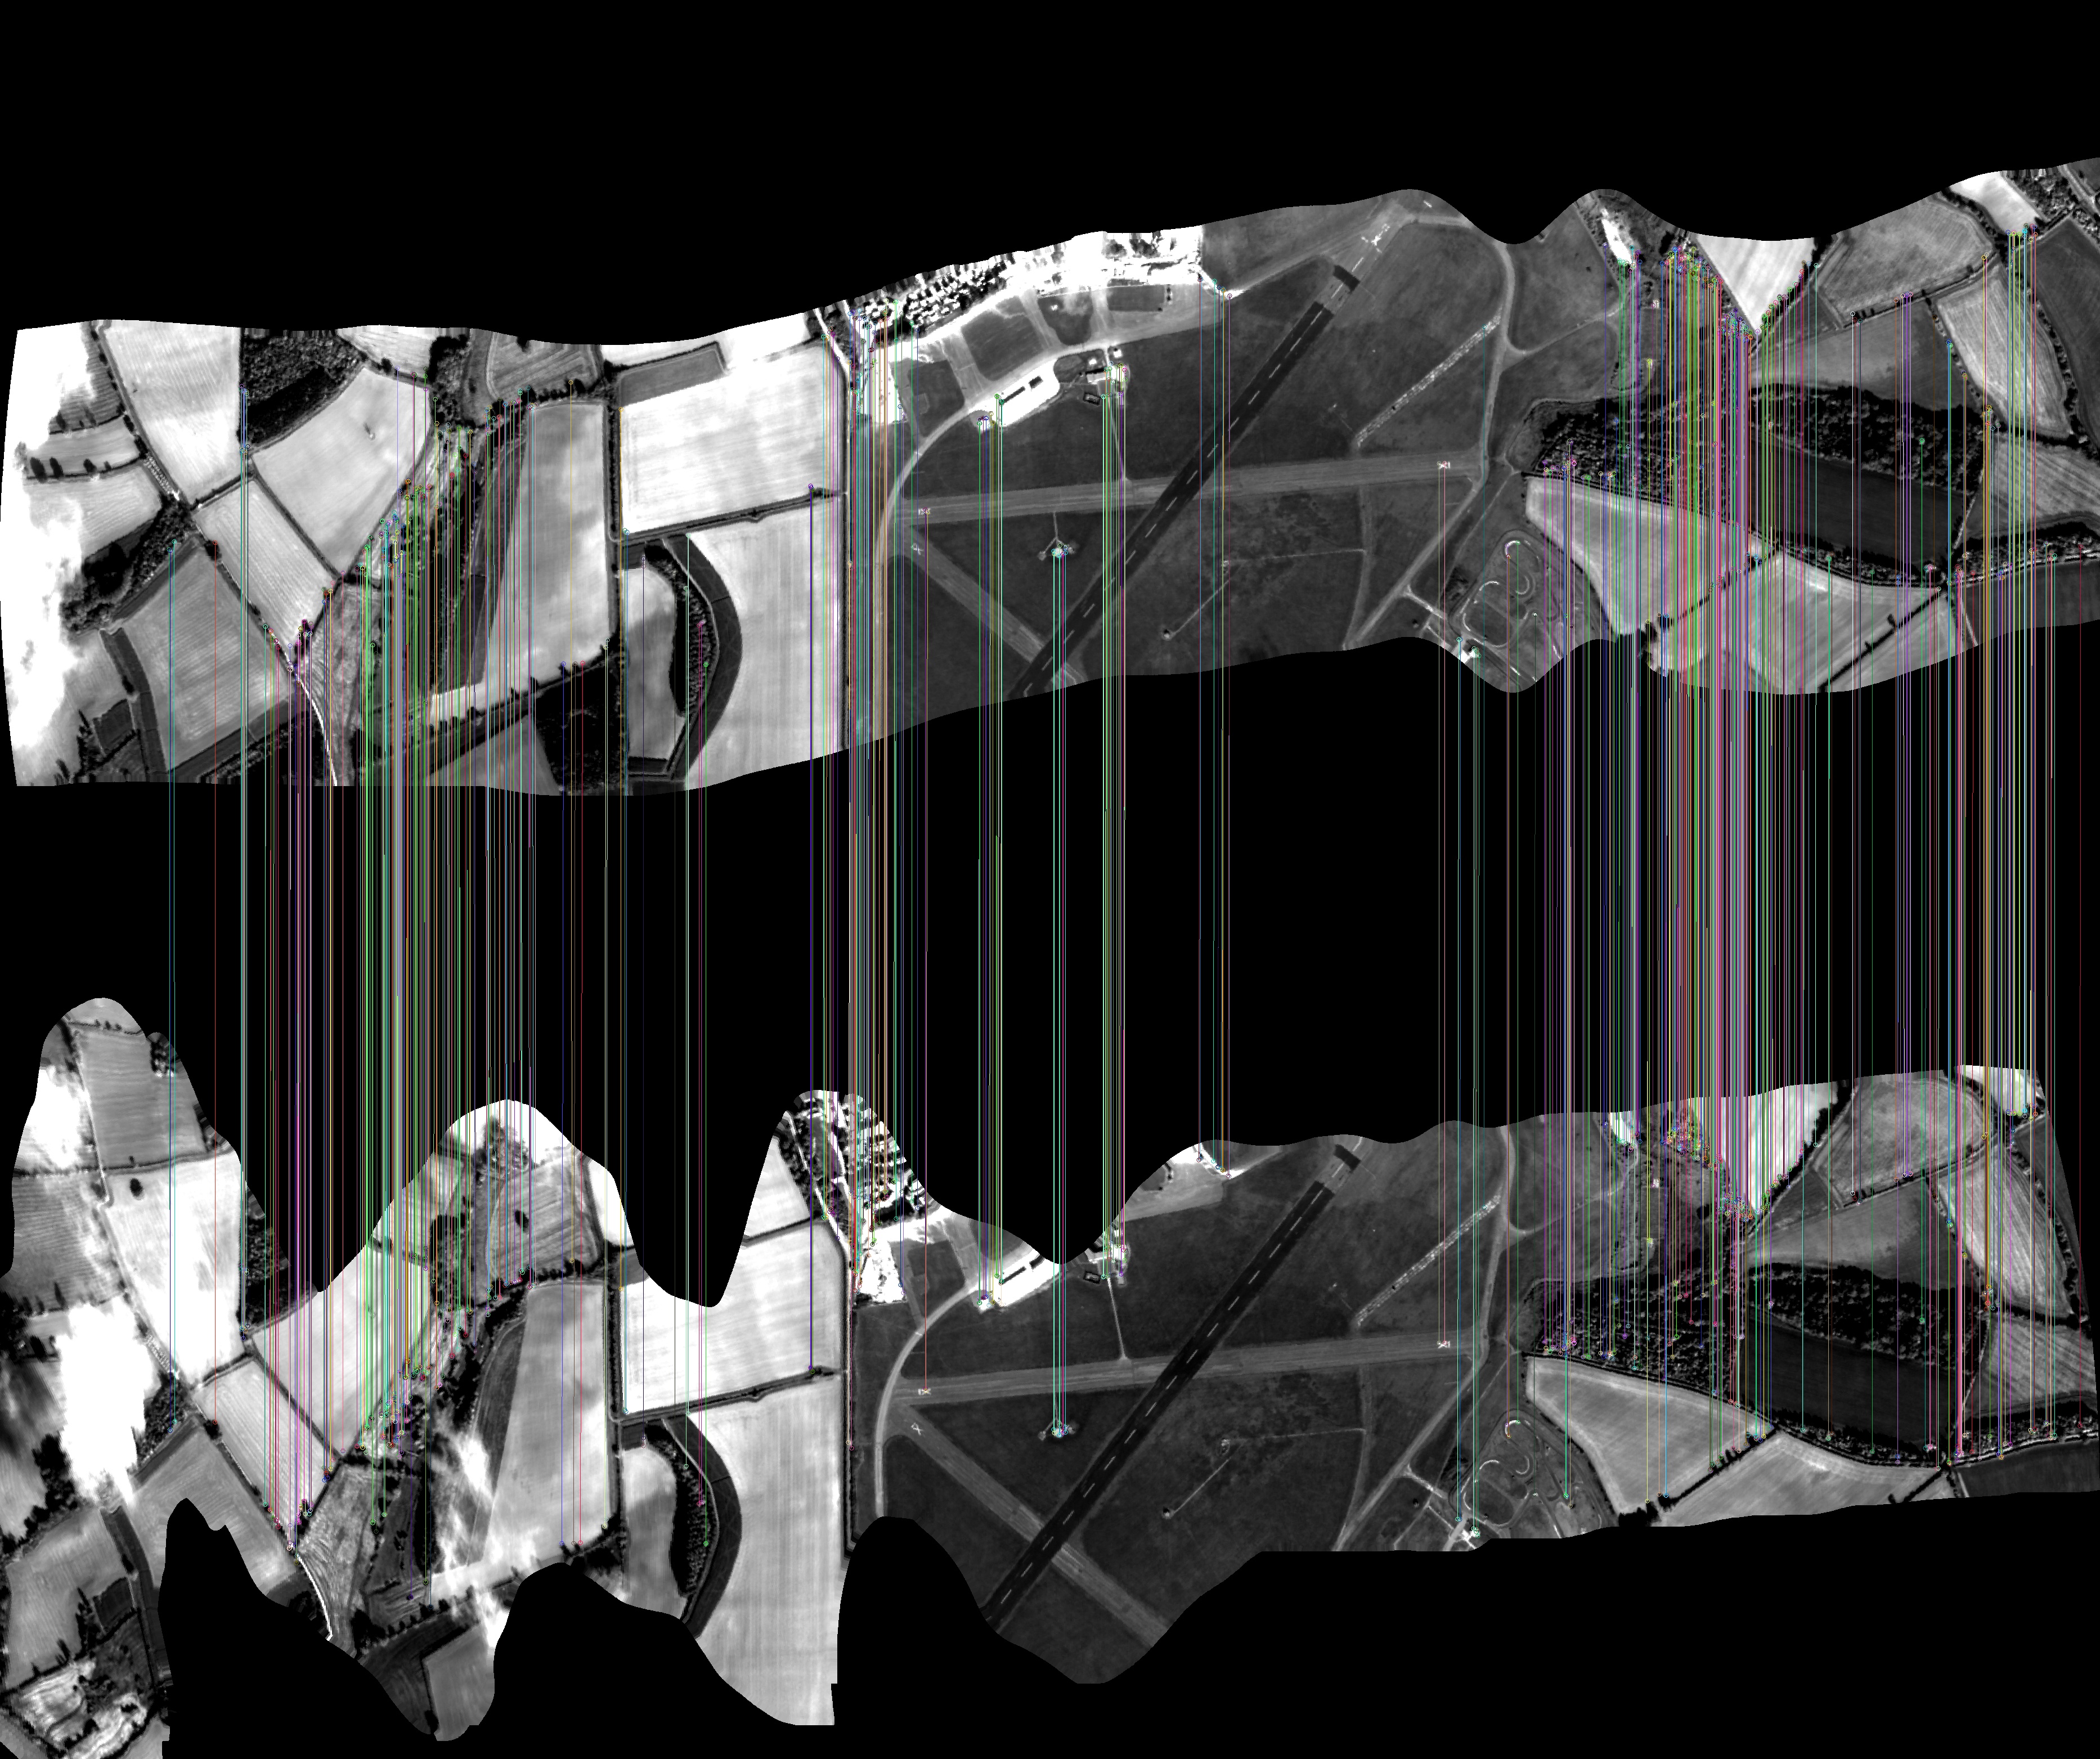
.
If you see tie point lines which are not vertical it is an indication that the tie points identified may not be actual matches. This can happen when tie points are identified very close to the edge of the of the flight line. In this instance you should use alternative flight lines if you have suitable data available.
Distribution Plot#
The box and whisker plot shows the calculated offset angle as a green line, the box extends from the lower quartile to the upper quartile, and the whiskers cover the extent of all calculcated angles. In instances where calculated angles are considered outliers, these are plotted as circles. The number of tie point matches is shown in blue just above the x axis.
